

I’m not normally one for crazy printable vacation countdown calendars. Well, maybe I would be, but I’m just not that organized. This year, my oldest, Isabella has been struggling with going to school. Crying in the morning and before bed. Dreading it even when she’s doing something fun.
I remembered back to my own childhood when my mom gave us a bunch of challenges each day throughout the summer to “earn” our vacation. Even though some of them were hard or took some work, it was so much fun. I specifically remember making a cake and having to do a lot of sit ups! haha
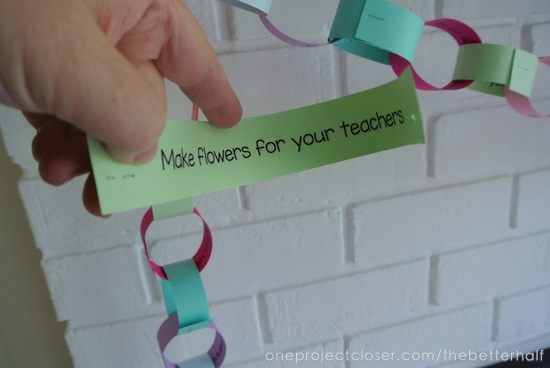
So I decided to give her something to look forward to. Each day, when she gets home from school, she and my younger daughter, Lucy rip off another link, read it, and proceed with the fun.
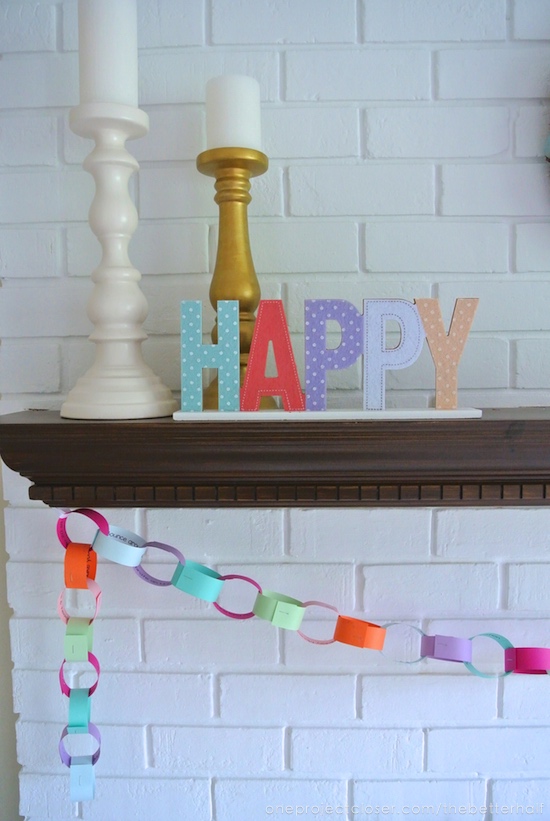
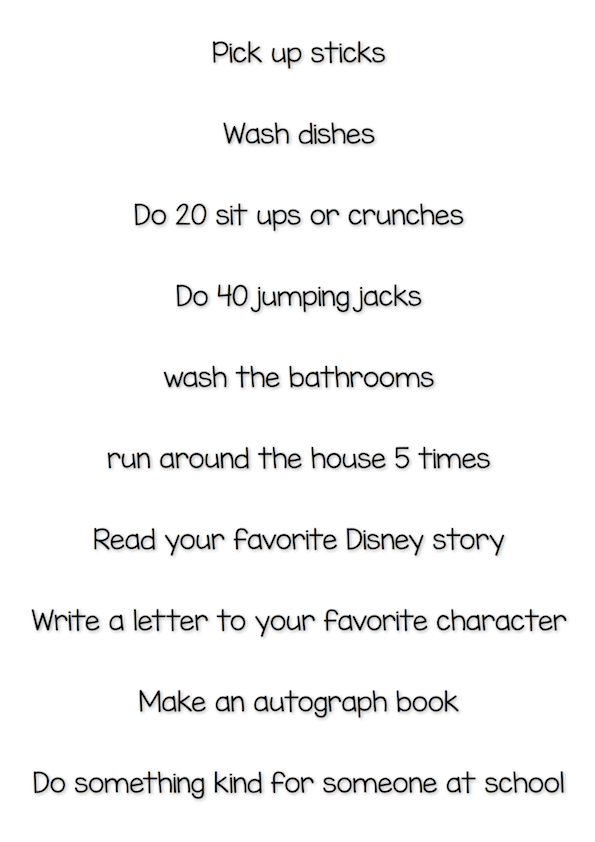
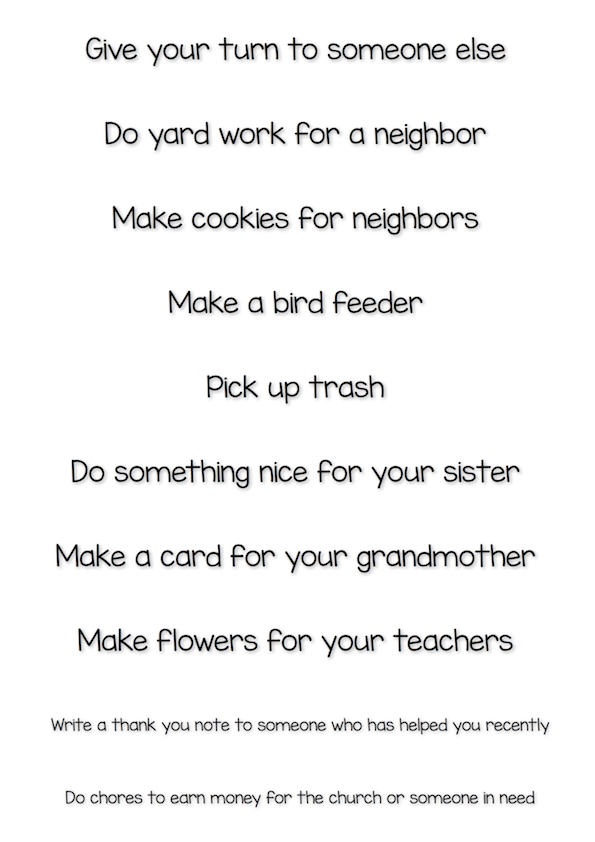
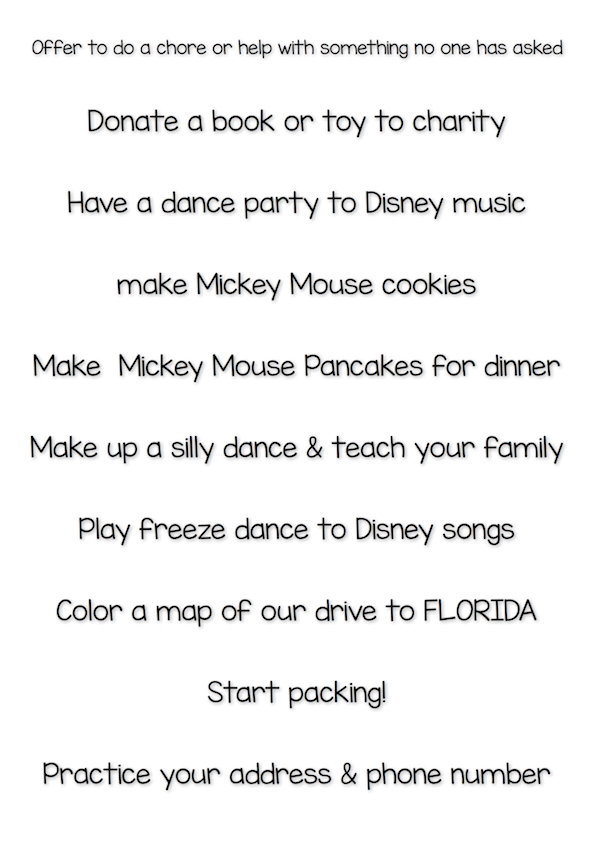
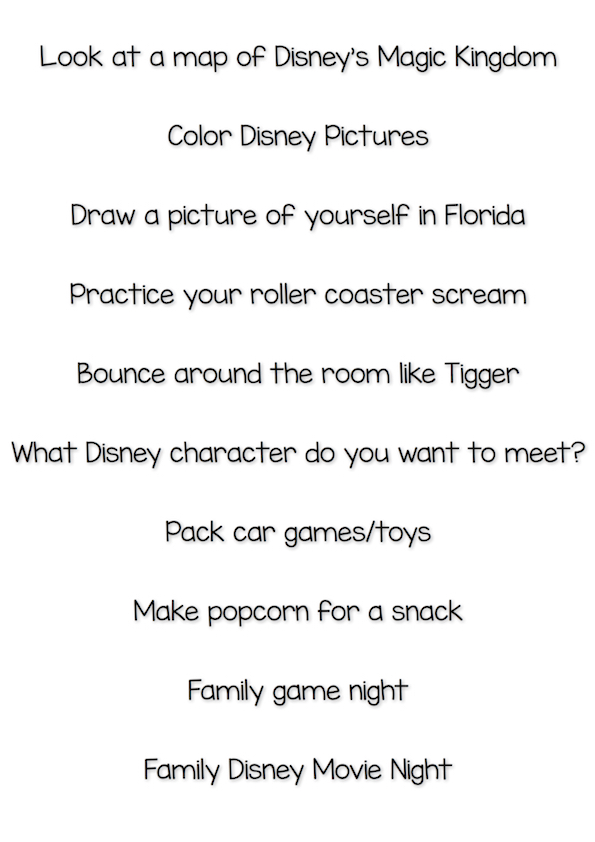
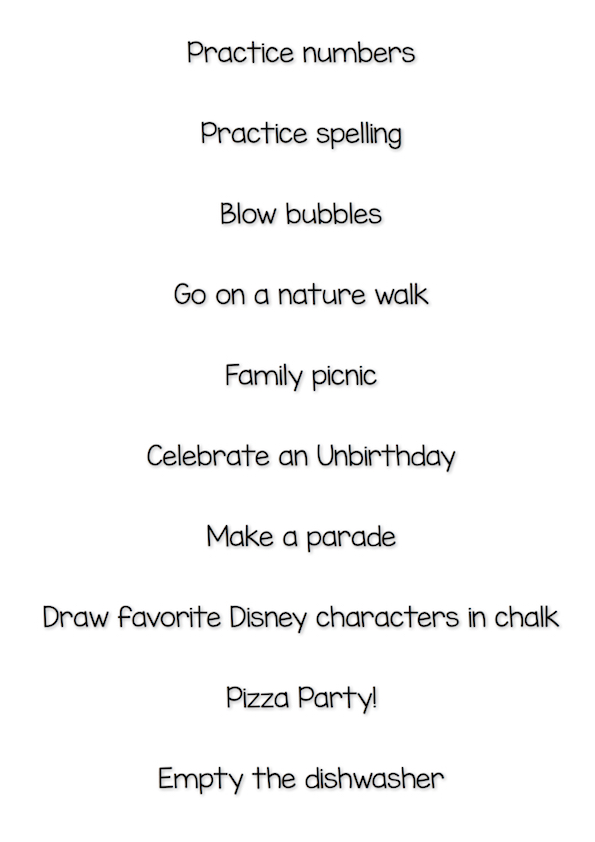
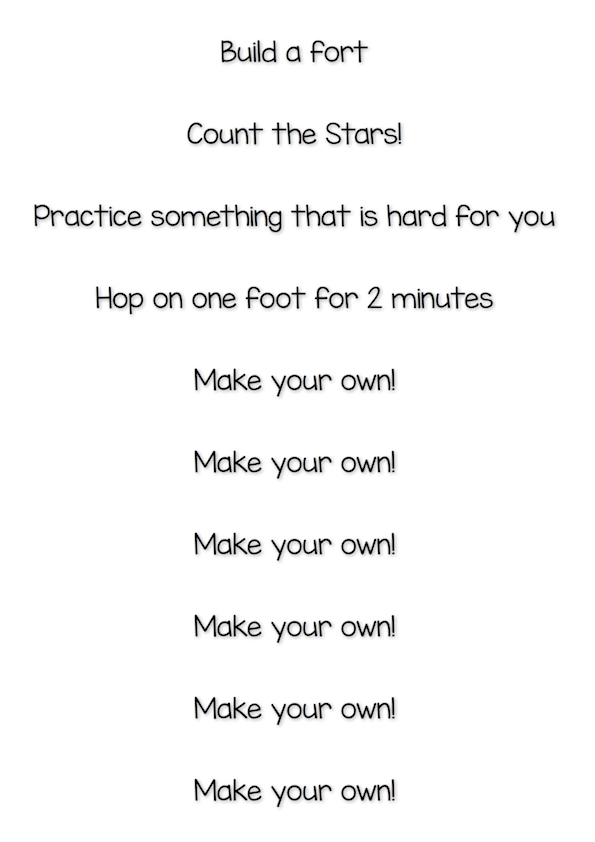
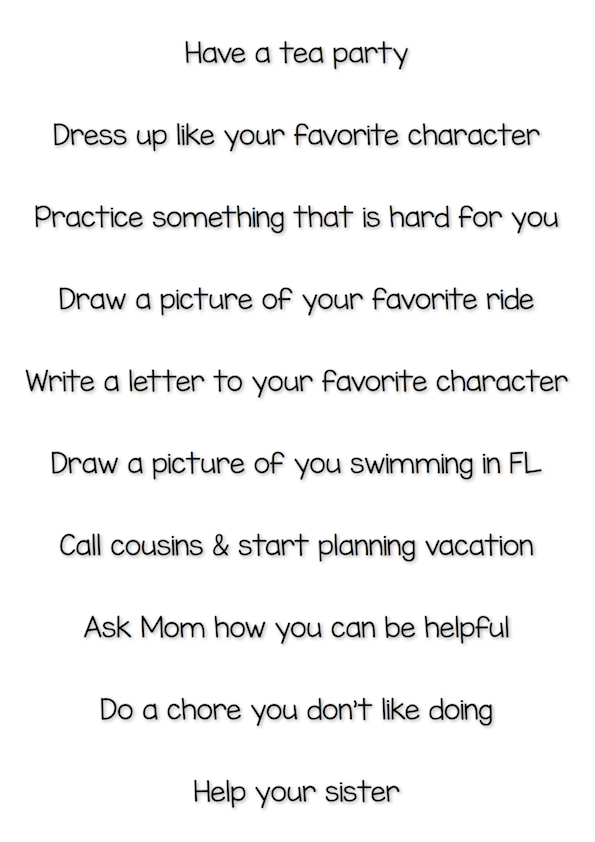
Here are 75+ printable vacation countdown calendar ideas! All you have to do is print out each sheet (I used a different color for each page), cut them into strips, then staple them into a chain.
Page 1 | Page 2 | Page 3 | Page 4 | Page 5 | Page 6 | Page 7
I should warn you… not all of the them are fun. Some are work. Some are silly. And some are acts of kindness. But no matter what, it keeps her excited throughout the day and gives her something to look forward to. Okay, and so maybe I also look forward to her picking up sticks and unloading the dishwasher too.
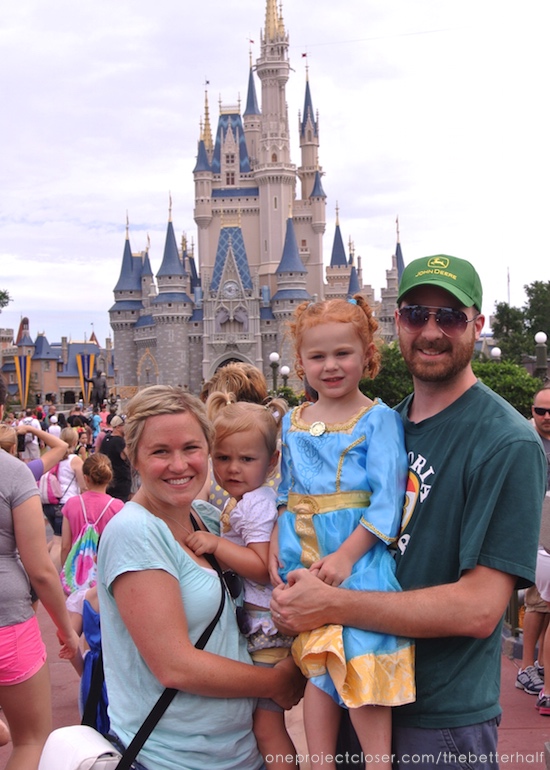
Two years ago, we went with my sister and her family to Disney (for a day, haha) and had the best time! We are really looking forward to going back this year, especially since the girls are two years older. Plus, my older nieces are awesome babysitters, so even Mommy and Daddy have a great time!
I would love to hear, how do you get your kids excited for summer, vacation, and Disney? What are your vacation countdown ideas?
As Always, thanks for reading!

Don’t forget to check us out on Facebook, Pinterest, and Instagram!

I absolutely love the idea of a little hard work and fun to ‘earn’ a Summer vacation … I’m pretty sure I’m going to do a version of your vacation countdown for my boys!
That is SUCH a great idea! I’m totally going to do this for my boys. They need summer activities and I think it would be fun to have it be a surprise…even if they are chores!
Oh that is a neat idea… I know a couple of kids who might enjoy this!
Trying to figure the 10% off sale for 2 days
Trying to figure the 10% off sale for 2 days